How to Lie with Statistics


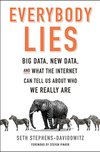
Everybody Lies: Big Data, New Data, and What the Internet Can Tell Us About Who We Really Are
amazon.com
Anscombe’s Quartet : Four sets of numbers that look identical on paper (mean average, variance, correlation, etc.) but look completely different when graphed. Describes a situation where exact calculations don’t offer a good representation of how the world works.
Morgan Housel • 100 Little Ideas
